Your Whole Publishing Business. One Screen.
Every platform, every format, every dollar — pulled together into one dashboard that finally tells you the truth about how your books are actually doing.
See Your Business at a Glance.
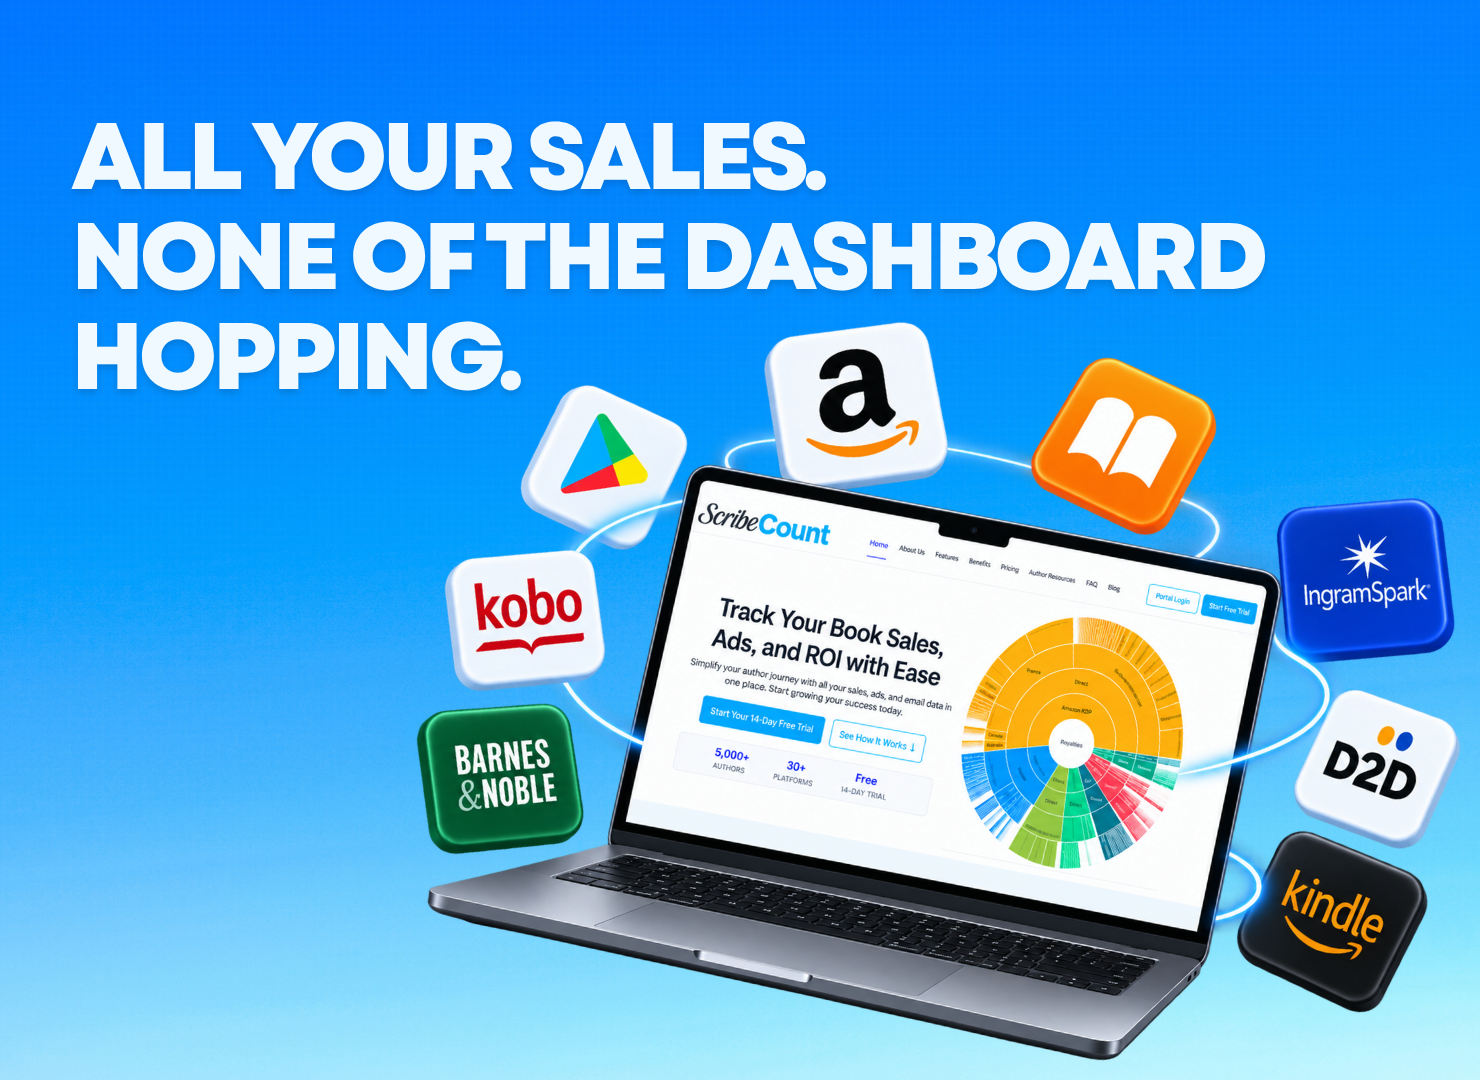
Most royalty reports make you dig — click into a platform, then a format, then a date range, just to understand one piece of the picture. The Sunburst Chart flips that around. One glance shows you your entire business broken down by platform, format, country, pen name, and storefront, all at once, all in relation to each other.
Want to zoom into just Amazon? Just audiobooks? Just last quarter? Click in, and the chart reshapes around exactly what you're looking for — no separate reports, no rebuilding a filter from scratch every time.
- One visual that shows platform, format, country, and pen name together
- Click to zoom into any slice without leaving the chart
- See where your business is concentrated — and where it isn't
- Built for the way authors actually think about their sales, not spreadsheet logic

Stop Logging Into Six Different Places.
Amazon. Apple. Kobo. Barnes & Noble. Google Play. Your direct store. Every retailer has its own dashboard, its own login, its own way of reporting numbers — and none of them talk to each other. ScribeCount pulls every platform into a single dashboard, so you see your whole business as one picture instead of six disconnected fragments.
Compare wide performance against KU. See free downloads next to paid sales. Break it down by format — ebook, audiobook, paperback, hardcover — without opening a single retailer site.
- Every sales platform combined into one unified view
- Compare wide vs. KU, free vs. paid, format vs. format
- No more manually reconciling numbers across six logins
- One consistent reporting logic, no matter where the sale happened
Know If You're Actually Growing.
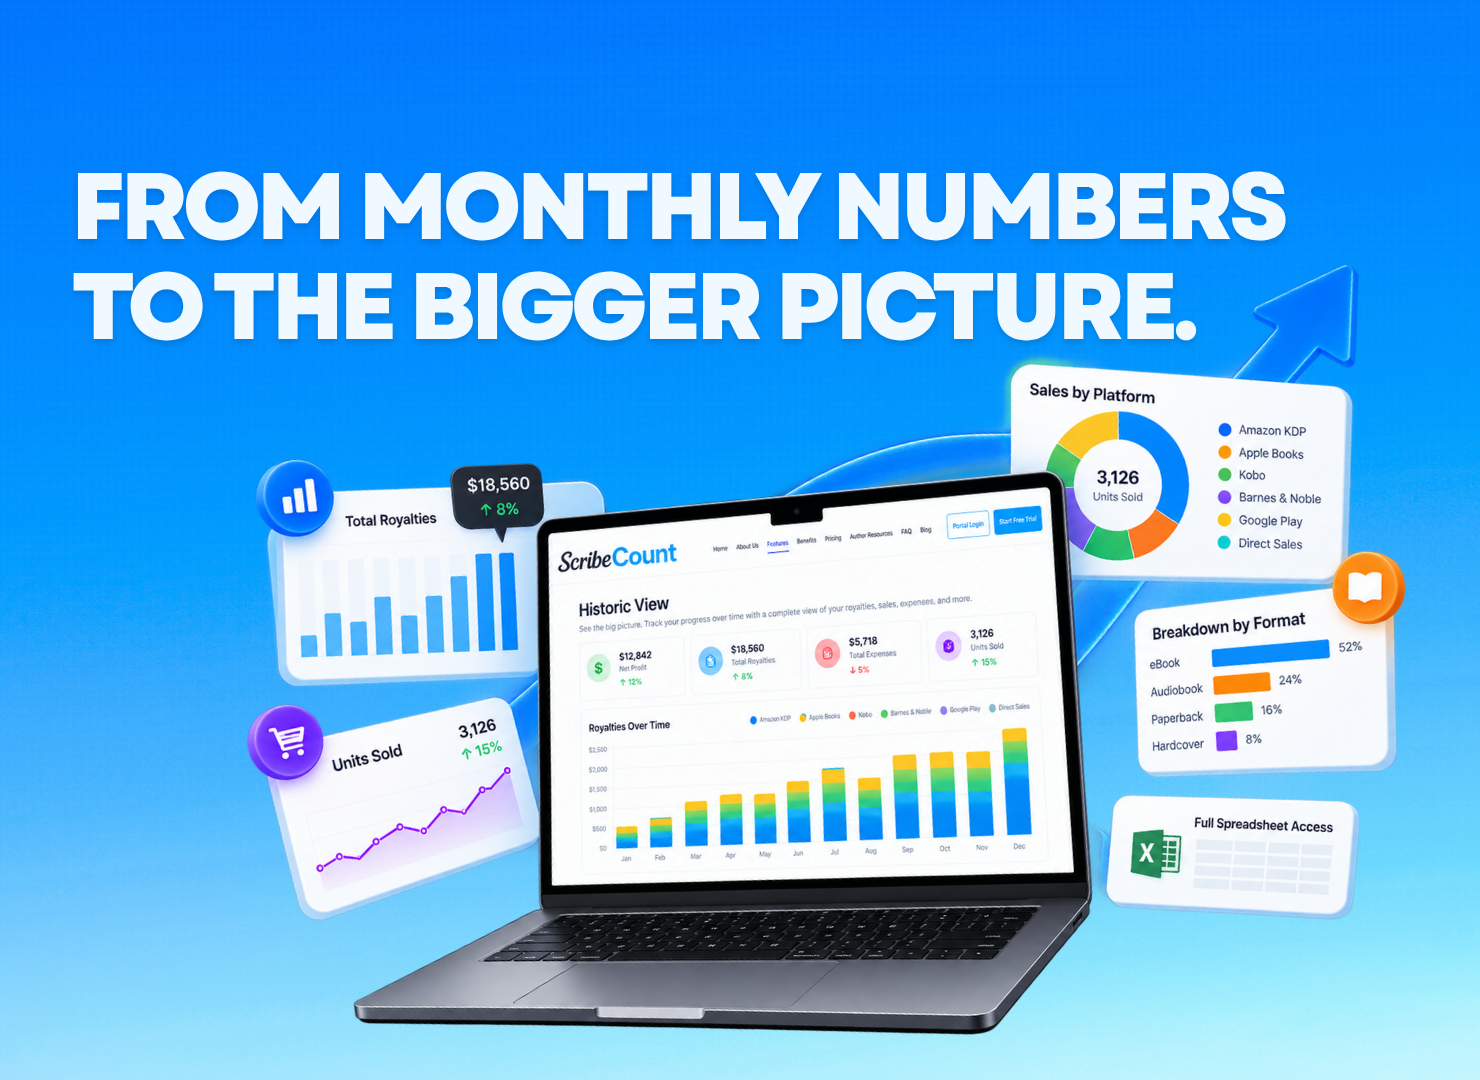
A single month's numbers only tell you so much. The Historic view shows you the full arc — net profit, total royalties, expenses, ad spend, and units sold over time, broken down by format and platform, so you can see the trend, not just the snapshot.
Bar charts for royalties over time. Donut charts by platform, series, or date range. A full spreadsheet view when you need the raw numbers. However you like to look at your data, it's there — and it's honest about where your business is actually headed.
- Net profit, royalties, expenses, and ad spend tracked over time
- Breakdowns by format: ebook, audiobook, paperback, hardcover, and more
- Visual trend charts plus full spreadsheet access
- See real growth patterns instead of guessing from memory
Plan Ahead. Report However You Need To.
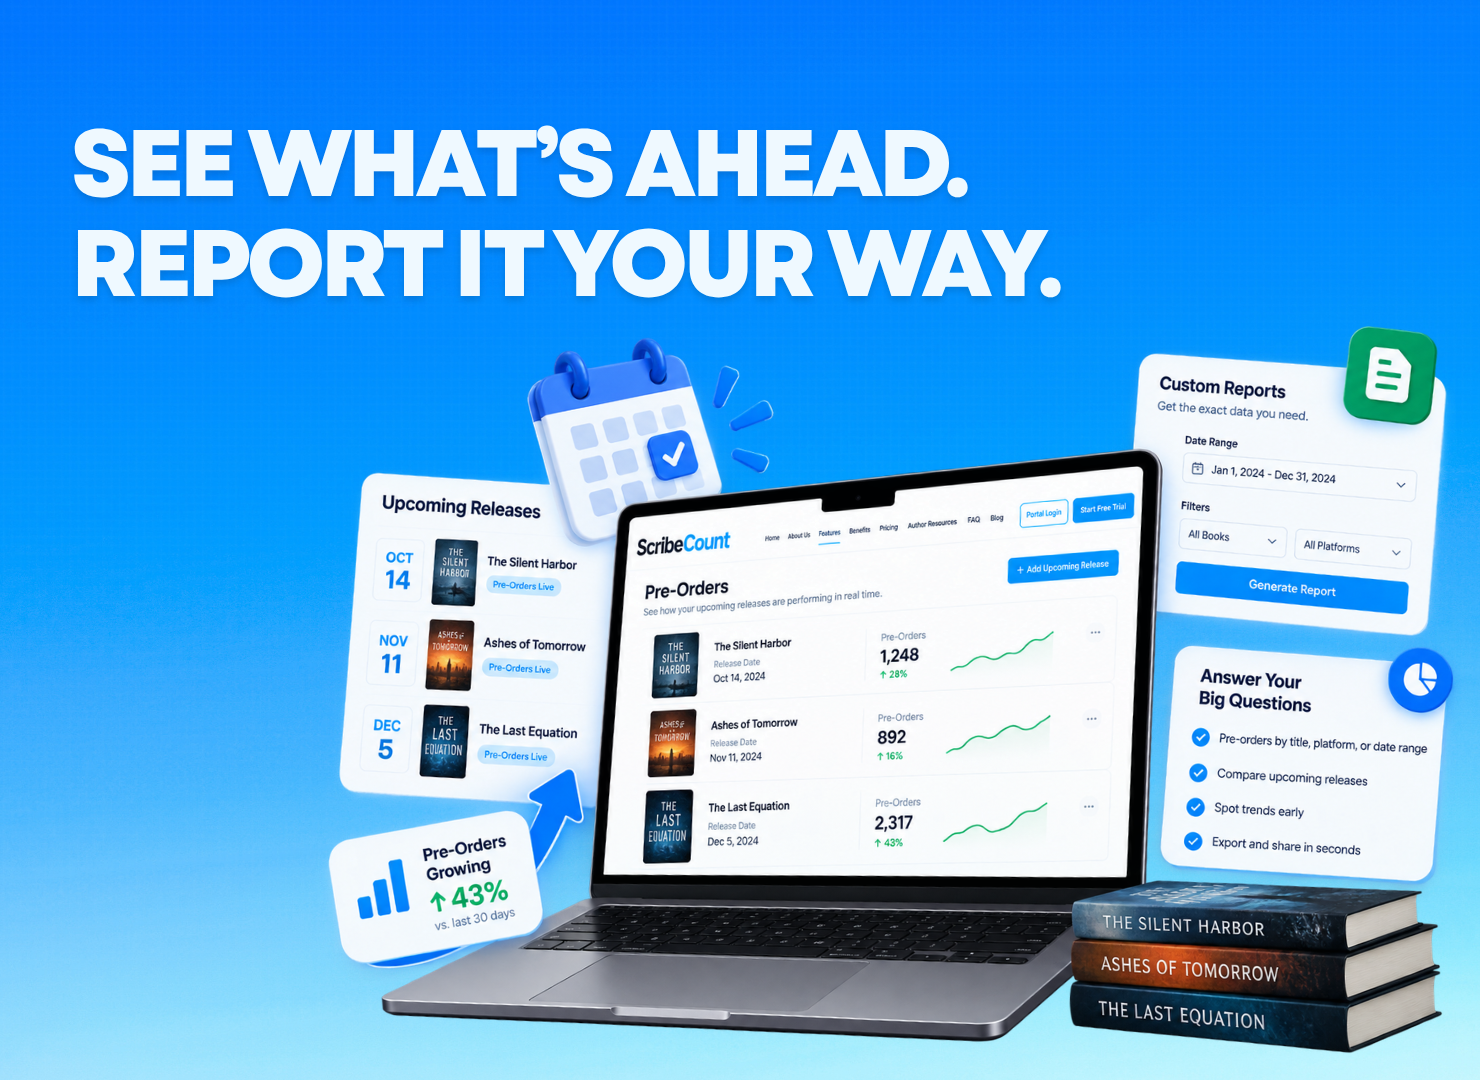
Launch week shouldn't be a mystery. The Pre-Orders view shows you exactly how each upcoming release is building — by book, in real time — so you know what to expect before release day arrives instead of finding out after.
And when the built-in views don't answer the specific question you have, Custom Reports let you build exactly what you need — any date range, any combination of filters — so you're never stuck exporting a spreadsheet just to get the one number you're after.
- Track pre-order momentum by title, updated in real time
- Build custom reports for any date range or combination of filters
- Answer the specific question you have, not just the ones built in
- No more spreadsheet gymnastics to get the number you actually need
A Dashboard Was Never Supposed to Be the Whole Story.
Most royalty trackers stop at the numbers — here's what you sold, good luck figuring out what to do with it. The ScribeCount Sales Dashboard is different, because it isn't a standalone reporting tool. It's the financial core of your entire Author Operating System.
Your royalty data connects to your production plan in AuthorFLOW, your marketing performance in Email and Linking, and your website traffic — all in one dataset, behind one login, using one consistent definition for every metric. So when a number moves, you're not left wondering why. You can trace it.
So when you ask a question like "Did my last launch actually move the needle, and where did those sales come from?" — you don't have to check five different tools to find out. ScribeCount already knows. And with Hey ScribeCount?, you can just ask.
This is what it looks like when your sales data stops being a static report and starts being the foundation your whole business runs on.